
Research Article
Abstract
The proximal and mineral profiles of multi floral honeys
from different geographic regions were determined and related to their origin. Moisture,
°Brix sugars, ash, pH, free acidity, water activity (aw) and
minerals content were determined by AOAC methods. In the exploratory analysis, non-supervised
chemometric methods were applied to build classification rules and relate the
origin of the samples based on their physicochemical parameters and mineral
content. The means of the physicochemical parameters obtained were °Brix-sugars
(82.44±1.68%), moisture (16.49±1.19%), pH (3.97±0.22), free acidity (24.07±6.79
meq/kg), aw (0.59±0.02), ash (0.24±0.11%). These values
demonstrate the high quality of the honey analyzed. Among the minerals, K was
the most abundant in all samples, ranging between 363.26-2034.11 mg/kg followed
by P (45.43-115.63 mg/kg), while Cu was the least abundant (0.18-2.02 mg/Kg).
The results showed differences in composition and mineral profile between
honeys from different regions. The first three factors of the Principal Component
Analysis method explained more than 67% of the variance and minerals had the
highest discriminatory power, while hierarchical cluster analysis successfully
classified the honey samples. The results show that mineral content is a capable
geographical indicator to identify the origin of honey and the use of
chemometric methods with proximal analysis and mineral content could be applied
to determine the quality and authenticity of honey.
Abstract Keywords
Honey,
physicochemical parameters, mineral profile, geographical origin, chemometric
methods, Argentina.
1. Introduction
Honey is a natural sweet substance with beneficial health properties, and so its consumption and demand have been increasing over the years [1-7]. All over the world, both producers and consumers, especially Europeans, have a greater interest in the quality and authenticity of honey demanding, even, the certainty of no adulteration of the marketed product [1, 8].
Argentina is one of the leading exporters of honey, and its quality is internationally recognized [9-13]. The leading honey producers in Europe are France, Spain, Greece, and Italy. Despite its high production and high consumption, the European Union still depends on the importation of honey to be able to supplant the quantities demanded by consumers [8]. For this reason, their interest in high-quality agricultural products, such as honey, has increased as well as the protection of such goods towards the use of its geographical indication (GIs). Portugal, Spain, France, and Italy are the leading countries where honey is classified as a protected designation of origin (PDO) product [7, 8, 14]. In addition, the GI can be a marketing tool that confers economic value to products with identity features that are difficult to be exactly expressed, as is the case of the multifloral honeys. Therefore, it is necessary to accurately define the quality, composition, and traceability of honey [1]. Its composition depends on many natural and anthropogenic factors, such as its type (nectar or honeydew), floral source, environmental conditions, season, harvest, processing, and storage [3, 8].
The main components of honey are the sugars, namely, glucose, fructose, and sucrose. Other minor components such as organic acids, enzymes, phenol antioxidants, aroma compounds, vitamins, minerals and waxes are also found within its chemical profile as well as pollen grains [3, 8]. Honey composition is strongly associated with the soil characteristics of the region where it is produced (geographical origin) and the type of plants endemic to such area (botanical origin). Determining the origin of honey allows for defining its authenticity and traceability [1, 3, 7, 15].
As a multi-component system, honey needs a multi-factorial system (parameters or variables) to be correctly qualified according to its quality, composition, and traceability. Additionally, to honey’s intrinsic parameters, mathematical or statistical tools capable of analyzing and combining the obtained complex data set must be used to interpret and analyze the gathered information correctly [1, 16].
Chemometric methods are being increasingly used, they can identify a natural clustering pattern and group variables based on similarities between the samples [17, 18]. There are multivariate supervised and non-supervised
methods that help to reduce, understand, and interpret the complexity of large
data sets. These methods have been used to classify correctly different foods
and relate them to their geographical origin [19-21].
The quality, authenticity, type (nectar or honeydew honey), and botanic origin of the honey have been defined and determined by complementary classical methods: physicochemical, and pollen content assays along with microbiological and sensorial analysis [22-25].
In addition to defining the quality and composition of honey, physicochemical parameters separated or together with other variables (e.g. content of minerals), in combination with the multivariate methods, have been used to characterize and distinguish its botanical and geographical origin [10-16, 26-33].
The mineral content also contributes to the control of the quality of honey since there are factors that can result from anthropogenic sources, such as environmental pollution [3, 14]. However, the content of minerals in honey is not yet set as a parameter of quality required by international regulations [34].
According to human nutritional needs, minerals can be divided according to their requirements (R) into different groups. The macroelements (R >100 mg/day) Na, K, Ca, Mg, P, and Cl; microelements (R <100 mg/day); Fe, Cr, F, Zn, Mo, I, Cu, Mn, Se; trace (R microgram or nanogram) Ni, Va, B, Sn, Li, Si and Co; and elements toxic As, Pb, and Cd [8, 35].
There are different methods for the determination of mineral content, among them are flame atomic absorption spectrometry, electrothermal atomic absorption spectrometry, inductively coupled plasma optical emission spectrometry (ICP-OES), inductively coupled plasma mass spectrometry (ICP-MS) [10 15, 30, 36]. ICP-OES and ICP-MS techniques allow the simultaneous determination of multi-element, with advantages over others. These methods offer a wide range of linearity, reproducibility, sensitivity and high efficiency needing less time in the determination quantification stages [8, 15].
Given the relationship that exists between the collected material from plants by bees and the honey’s mineral profile, the work conducted in several disclosed studies has been using the honey’s mineral profile in combination with chemometrics methods to relate them to their origin soil [10-16, 27, 31, 33].
In the characterization or differentiation of certain samples of a geographic origin, the evaluated parameters are expressed as mean±uncertainty (X±U). Uncertainty is defined as a parameter associated with the result of a measurement that characterizes the dispersion of the values that could reasonably be attributed to the measurement [37]. Although the uncertainty due to the analytical method introduces certain variability to the results of the parameters used in the differentiation of the samples, its value is not considered in the processing of the data; multivariable methods employ only the average for the analysis of the data [38].
This work aimed to analyze the
quality and mineral profile of artisanal honey from different regions and apply
chemometric methods to relate these values to the identification of their
geographical origin.
2. Materials and methods
2.1 Samples
Samples of honey (Apis mellifera) of floral origin (multifloral) from Angola (n= 4), Portugal (n= 5) and Argentina (n= 11) were analyzed. All of them were composite samples obtained from different beekeepers of the same region. After collection, they were stored in a dark place and refrigerated (5-7 ° C) until analysis. The samples come from small regions with distinctive flora, climate, soil, and apicultural aptitude of each country. In Argentina, they correspond to the region of the Yungas of the province of Jujuy located in the northwest of the country. Portuguese honey belongs to the Alentejo region. The samples called Angola belong to the municipality of Cuito Cuanavale, province of Cuando Cubango, located in the southeast of the country. The honeys from the three geographical origins were artisanal since their production is incipient and their extraction is done manually.
2.2 Reagents and chemical standards
All reagents were of high analytical grade. Deionized water of level I, as EN ISO 3696, was used for the preparation of all solutions. The nitric acid (65%) and hydrogen peroxide solutions used were of ultrapure grade, and nitric acid (65%) was first distilled, in an acid distillation system (Milestone SubPUR). A 2% concentration solution of nitric acid was used to prepare working standard solutions, dilute samples and to prepare blanks. A nitric acid solution with a 2–4% concentration was used to wash up the ICP-OES sample introduction system. Working multi-element standard solutions were prepared from mono-element high-purity ICP stock standards containing 1000 mg/L of each element (Copper, Manganese, Iron, Zinc, Magnesium, Calcium, Phosphorus, Sodium, and Potassium).
2.3 Physicochemical analysis
The analysis of the samples was carried out in triplicate (n=3) by the Official Methods of Analysis of the Association of Official Analytical Chemists [39]. The °Brix, moisture, free acidity, aw, pH, and ash content were determined. The °Brix (Soluble sugar content) was determined by refractometry at 20±0.1 ºC (Refractometer Abbe, Polish). The moisture content was evaluated by the gravimetric method, using a nitrogen atmosphere with vacuum bellow 100 mbar dry oven from Heraeus Instruments, Hanau, Germany, at 70 ± 2 °C, for two hours, using 5 g of sample, until constant weight [39].
Ash content was determined by calcination at 600 °C to constant weight. The pH was measured in honey with a pH-meter from Metrohm, Herisau, Switzerland, at 25 °C. Free acidity was determined by the titrimetric method in an automatic titration system from Metrohm, Herisau, Switzerland follows: 10 g of homogenized honey was weighed in a glass beaker, 75 mL of CO2-free water was then added, and this solution was titrated to pH 8.50 by adding 0.05 N NaOH.
Measurement of aw was made in AquaLab water activity Meter (AQUALAB PRE) to 20±1 °C.
2.4
Mineral analysis
Samples were digested in Microwave Digester (Milestone ETHOS 1 Series). 0.5-0.8 g of each sample was weighed in a Teflon vessel, 8 mL of a mixture of concentrated nitric acid, hydrogen peroxide and deionized water (4:1:3) was carefully added. After digestion, the samples were cooled and diluted with deionized water, for the subsequent quantification of minerals and trace elements.
The content of Cu, Mn, Fe, Zn, Mg, Ca, P, Na and K, was determined in an inductively coupled plasma optical emission spectrometry equipment, ICP-OES, (Thermo Scientific™ iCAP 6000, Cambridge, UK).
2.5
Internal quality control
Quality control data is presented in Table 1. The effectiveness of the quality system in place guaranted the reliability of the data generated. Different approaches were used according to the availability of certified reference materials and proficiency testing schemes after searching the Eptis database for proficiency testing schemes and reference materials database COMAR. All the analytical procedures were run under the ISO 17025:2005 requirements meaning that accepted criteria better than 10% for replicates was achieved. Quality Control procedures applied during each assay encompassed the use of certified reference materials achieving analytical results within the confidence interval of certificate or spiked samples with recoveries better than 90%. Laboratory successfully participated in PT schemes with a Z score <2. Other Metrological principles and practices were crucial to measure nutrients in honey such as traceability to SI units, approaches to estimate uncertainty and methods to calculate LOD and LOQ that fit for purpose.
Table 1. Quality assurance for honey analysis
|
Parameter |
Units |
Method of analysis |
LOD |
LOQ |
SRM/CRM/QCM |
Certified Value ± U |
Analyzed values |
|
°Brix |
g/100g |
Refractometer |
|
0.1 |
FAPAS 3131 |
7.1 ± 0.2 |
6.5 – 7.3 |
|
Moisture |
g/100g |
Oven-drying 70°C under vacuum |
|
0.1 |
NIST 1846 |
1.98 ± 0.27 |
1.77 – 1.91 |
|
Ash |
g/100g |
Ignition in muffle furnace |
|
0.1 |
NIST 2383 |
1.09 ± 0.04 |
1.09 – 1.11 |
|
pH |
Potenciometric |
|
0.1 |
FAPAS 3131 |
3.2 ± 0.06 |
2.9 – 3.3 |
|
|
Free
acidity |
meq/kg |
Titrition |
|
0.1 |
FAPAS 2830 |
16.9 ±
2.65 |
17.1 –
17.8 |
|
Minerals |
|
||||||
|
Cu |
mg/kg |
ICP-OES |
0.006 |
0.02 |
NIST 1548a |
2.3 ± 0.16 |
2.2 – 2.5 |
|
Mn |
mg/kg |
0.003 |
0.01 |
5.7 ± 0.17 |
5.2 – 5.7 |
||
|
Fe |
mg/kg |
0.007 |
0.05 |
35 ± 3.77 |
28 – 34 |
||
|
Zn |
mg/kg |
0.006 |
0.05 |
25 ± 1.79 |
23 – 26 |
||
|
Mg |
mg/kg |
0.116 |
0.4 |
580 ± 26.7 |
550 – 600 |
||
|
Ca |
mg/kg |
0.055 |
0.2 |
1970 ±113 |
1910 –
1960 |
||
|
P |
mg/kg |
0.130 |
0.4 |
3490 ± 245 |
3300 –
3570 |
||
|
Na |
mg/kg |
0.159 |
1 |
8130 ± 942 |
7760 –
8420 |
||
|
K |
mg/kg |
|
0.245 |
1 |
|
6970 ± 125 |
6660 –
7240 |
LOD: Limit of Detection; LOQ: Limit of Quantitation; U: uncertainty; ICP-OES: inductively coupled plasma optical emission spectrometry; SRM: Standard Reference Material/ CRM: Certified Reference Materials/ QCM: quality control material; NIST: Nutrients in Standard Reference Material; NIST 1846: Infant Formula; NIST 1548a: Rice Flour; NIST 2383: Baby Food; ICP-OES: inductively coupled plasma optical emission spectrometer.
2.6 Statistical analyses
Physicochemical parameters and mineral content were expressed as mean value ± standard deviation (SD), and other statistics for each geographic region.
Non-supervised chemometric methods were used to explore and analyze which variables (physicochemical characteristics and mineral content) could discriminate honey by geographical origin. They were used as exploratory methods of natural clustering in a multidimensional space. The principal component analysis (PCA) was performed on matrix data, after centering and auto-scaling the variables. Considering the geographic origin as a nominal variable (variation factor), the PCA factors that can separate or discriminate significantly (p<0.05) the samples from the 3 regions were evaluated, using the statistical test value (V-test) that follows the distribution of a law Laplace-Gauss [40]. STATISTICA software version 8.0 (Data analysis software system) and XLStat trial (Copyright © 2015 Addinsoft) were used for statistical analysis.
3. Results and discussion
3.1 Analytical quality control
Quality control data are presented in Table 1. It can be seen for all components under study that the LOD and LOQ of the methods were below the minimum value obtained in the samples. Quality assurance in honey identification and characterization is probably the most challenging aspect for analysis. This was already discussed by [29] and this work was aligned with those findings. The complexity of the honey matrix needed the application of many different analytical procedures, with the employment of many diverse sample preparation protocols and diverse instrumental techniques.
3.2 Honey's quality parameters
Table 2 shows the mean ± SD values and other descriptive statistics of the physicochemical and mineral parameters of the honey from three different geographical origins. Those parameters demonstrate the adequate quality, composition, and absence of contamination during honey extraction and processing. The variation ranges determined for all the variables studied correspond to those of honey of floral origin [3, 8, 12].
Table 2. Physicochemical parameters and mineral content of honeys
Parameters **Mean ± SD Min-max | Argentina | Portugal | Angola | Total | Coefficient of asymmetry | CV | *CV min | *CV max |
83.69±0.70 82.40-84.50 | 81.42±0.43 81.00-82.00 | 80.27±1.46 78.30-81.80 | 78.30-84.50 | -0.7 | 2.03 | 0.03 | 0.35 | |
Moisture (%) | 16.09±1.01 15.16-18.18 | 16.19±0.45 15.70-16.75 | 18.00±1.23 16.60-19.60 | 15.16-19.60 | 1.04 | 7.22 | 0.2 | 4.22 |
pH (25°C) | 4.07±0.23 3.61-4.45 | 3.89±0.17 3.68-4.15 | 3.83±0.13 3.67-3.98 | 3.61-4.45 | 0.18 | 5.49 | 0.35 | 5.68 |
aw | 0.59±0.01 0.58-0.61 | 0.57±0.01 0.56-0.58 | 0.59±0.01 0.57-0.60 | 0.56-0.61 | -0.59 | 2.63 | 0.11 | 5.34 |
Free acidity (meq/kg) | 25.71±6.49 15.21-33.63 | 24.88±7.71 17.20-37.20 | 18.57±4.53 12.90-24.00 | 12.90-37.20 | 0.2 | 28.19 | 1.42 | 7.12 |
Ash (%) | 0.22±0.11 0.08-0.40 | 0.28±0.14 0.15-0.47 | 0.23±0.08 0.13-0.30 | 0.08-0.47 | 0.57 | 45.46 | 0.37 | 9.2 |
Mineral (mg kg-1)** | ||||||||
Cu | 0.94±0.59 0.18-2.02 | 0.61±0.44 0.23-1.37 | 0.29±0.08 0.23-0.40 | 0.73±0.55 0.18-2.02 | 1.24 | 75.05 | 1.71 | 9.55 |
Mn | 1.00±0.65 0.45-2.78 | 4.10±4.15 0.76-10.83 | 2.07±0.73 1.16-2.96 | 1.99±2.38 0.45-10.83 | 3.07 | 119.68 | 0.12 | 4 |
Fe | 1.55±0.36 0.93-2.26 | 1.78±0.84 1.00-3.10 | 1.89±0.46 1.40-2.50 | 1.68±0.52 0.93-3.10 | 1.08 | 30.85 | 0.52 | 9.19 |
Zn | 1.26±0.65 0.77-3.04 | 2.59±1.46 1.44-5.10 | 0.63±0.29 0.22-0.89 | 1.47±1.09 0.22-5.10 | 2.22 | 74.35 | 1.12 | 9.98 |
Mg | 31.75±10.97 17.65-46.39 | 56.58±24.24 36.23-96.03 | 39.83±4.21 34.50-44.80 | 39.58±17.36 17.65-96.03 | 1.77 | 43.87 | 0.03 | 4.6 |
Ca | 61.15±14.60 42.92-84.24 | 51.14±30.21 10.80-95.23 | 102.97±48.52 51.05-167.79 | 67.01±32.16 10.80-167.79 | 1.54 | 48 | 0.24 | 8.05 |
P | 76.40±22.61 45.43-115.63 | 98.41±10.54 85.91-114.36 | 73.76±9.65 60.14-81.27 | 81.37±20.25 45.43-115.63 | -0.01 | 24.88 | 0.35 | 5.16 |
Na | 12.85±3.49 7.58-19.39 | 31.65±9.94 17.89-45.92 | 44.17±28.78 11.11-81.26 | 23.81±18.19 7.58-81.26 | 1.88 | 76.41 | 0.6 | 9.8 |
K | 1040.48±498.27 363.26-1792.23 | 1296.8±437.14 968.71-2034.11 | 828.15±493.02 440.26-1523.85 | 1062.10±485.35 363.26-2034.11 | 0.48 | 45.7 | 0.08 | 5.74 |
*CV min and max: Correspond to values of variation of the analytical method; ** Mean + Standard Deviation; Range.
The moisture (<20%) and sugar (>78%) contents are within the limits internationally established, indicating the correct maturity of the product [34]. This quality parameter is related to the botanical origin, extraction and processing methods of honey [3, 8, 34].
The moisture is inversely correlated significantly (p < 0.05) to °Brix (directly related to sugar content) due to the maturation process of the honey, (Table 3). The °Brix have a weak correlation with aw, reported for honey of different botanical origins [22, 29]. The results of these parameters suggest that the analyzed honey has an adequate quality of maturity [3, 8, 22].
Table 3. Correlation matrix (Pearson)
Variables | °Brix (Sugar)s | Moisture | pH | aw | Ash | Free acidity | Cu | Mn | Fe | Zn | Mg | Ca | P | Na | K |
| ||||||
°Brix (Sugars) | 1 |
| ||||||||||||||||||||
Moisture | -0.72 | 1 |
| |||||||||||||||||||
pH | 0.50 | -0.35 | 1 |
| ||||||||||||||||||
aw | 0.52 | -0.11 | 0.35 | 1 |
| |||||||||||||||||
Ash | -0.13 | 0.29 | 0.47 | -0.10 | 1 |
| ||||||||||||||||
Free acidity | 0.19 | 0.09 | 0.18 | -0.17 | 0.52 | 1 |
| |||||||||||||||
Cu | 0.55 | -0.61 | 0.61 | 0.18 | 0.09 | 0.26 | 1 |
| ||||||||||||||
Mn | -0.23 | -0.11 | 0.07 | -0.38 | 0.47 | 0.29 | 0.13 | 1 |
| |||||||||||||
Fe | -0.09 | 0.08 | -0.06 | 0.01 | 0.33 | 0.05 | -0.02 | 0.12 | 1 |
| ||||||||||||
Zn | -0.04 | -0.16 | -0.27 | -0.42 | 0.05 | 0.25 | -0.03 | 0.01 | 0.47 | 1 |
| |||||||||||
Mg | -0.26 | 0.05 | 0.08 | -0.48 | 0.64 | 0.37 | -0.03 | 0.84 | 0.11 | 0.04 | 1 |
| ||||||||||
Ca | -0.49 | 0.63 | 0.19 | -0.08 | 0.38 | 0.10 | -0.10 | 0.19 | -0.12 | -0.56 | 0.22 | 1 |
| |||||||||
P | -0.25 | 0.29 | 0.00 | -0.34 | 0.72 | 0.50 | -0.19 | 0.44 | 0.02 | 0.26 | 0.68 | 0.08 | 1 |
| ||||||||
Na | -0.84 | 0.74 | -0.20 | -0.46 | 0.36 | -0.02 | -0.43 | 0.16 | 0.27 | 0.12 | 0.22 | 0.63 | 0.20 | 1 |
| |||||||
K | -0.04 | 0.18 | 0.46 | -0.24 | 0.82 | 0.54 | 0.15 | 0.37 | -0.04 | 0.04 | 0.65 | 0.40 | 0.73 | 0.27 | 1 | |||||||
The values in bold are different from 0 with a significance level α = 0.05
The free acidity, related to the deterioration by fermentation of honey, has values <40 meq/kg. This result is consistent with the absence of fermentation which is confirmed by the lack of correlation between free acidity-moisture. It is well known that the high moisture content in the honey favors the development of molds and yeasts leading to deterioration by fermentation. Another parameter related to the stability of honey is its acidic pH (25°C), which acts as a protection against microbial growth. The determined pH values range from 3.61 to 4.45, which are values acceptable and comparable with data reported by other authors [10, 13, 25]. All physicochemical parameters confirm the high quality of the studied honey from the three geographic origins [34].
It is observed that there is a positive correlation between the ash content of the different honey and their content of K, P and Mg, which are the predominant minerals of floral honey, indicating that the samples were not contaminated [27, 31].
Among the analyzed macro-elements, K was the most abundant mineral, (67.5% to 88% of the total mineral content). Once again, the presence of K as the predominant mineral is a characteristic of honey of floral origin [10, 13, 22, 24]. The second macro-element present in greater concentration is P for Portugal and Argentina honey, while for the honey collected in Angola is Ca. The P content is comparable to that reported in floral honey from other regions [13]. In the commercial, artisanal and multifloral honey from other locations, including Portugal and Argentina, the second most abundant mineral varies between Na, Ca, and Mg [10, 13, 14, 24, 31]. The mineral content of the honey has been broadly employed as an indicator of their geographical origin [1, 14, 31].
From the microelements, Mn is slightly correlated (p<0.05) positively with the content of ash [8, 15, 20]. On the other hand, the Cu is found in lower concentrations which would discard the anthropogenic contamination of the samples. Other authors reported significant positive correlations between Cu and some macro-elements (K and Ca) and micro-elements (Fe and Zn) in honey from Argentina. However, Cu determined values are those expected for honey from Argentina and other geographical regions [8, 10, 11, 12, 13, 30]. Considering the composition of the total mineral content, the positive relationship between them, and the amount of ashes, the combination of such information confirms that the analyzed samples were not contaminated by anthropogenic factors [8]. Therefore the mineral content could be considered adequate as a discriminatory parameter for the geographical origin of the honey [14]. The value of the asymmetry coefficient of the variables, with minimum for P and maximum for Mn, indicates that the variability of the data due to its origin does not follow a normal distribution, as it does in the case of the variability due to the errors of the analytical methods employed for its determination [14].
The physicochemical parameters except e free acidity and ash content, present low coefficients of variation (CV <10%), even the variables moisture, sugar content and aw have a smaller CV than that related to the corresponding analytical method. Contrarily, regarding the physicochemical parameters, the CV of the minerals is greater than 10%, that variability would be directly related to natural factors of honey (botanical and geographical origin). This explains why the mineral content is used as an indicator of the botanical and geographical origin of honey as well as in other foodstuffs [1, 12, 13, 15, 20, 21].
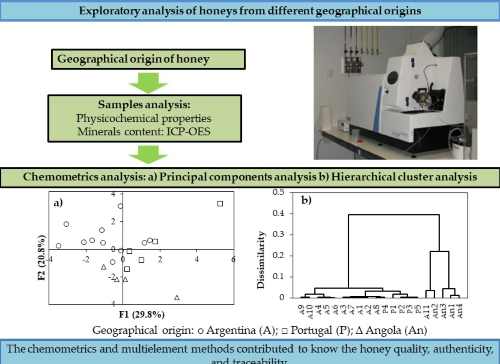
3.3. Principal component analysis (PCA)
Fig. 1 shows the results of the PCA applied to the physicochemical data and mineral content of the studied honey to correlate the obtained values to their geographical origin and to determine the discriminant variables. The PCA did not consider the °Brix measurement and ash content due to the high correlation observed with the variables (Table 2).

Figure 1. Principal component analysis performed on physicochemical
and mineral data of honeys. a) F1-F2 plane and b) F1-F3 plane.
Geographical origin of honeys: ○ Argentina (A); □ Portugal (P); ∆ Angola (An).
The first three PCA factors explain 67% of the variability of the data. The F1 variability explains 30%, mainly by the correlation between the content of K, P, and Ca, differentiating significantly (p<0.05) the honey from Argentina and Portugal. This is by the determination in honey from Morocco, where the macro-elements were found to be the discriminators with higher influence than the physicochemical parameters [13, 14]. As shown in Fig. 1a), the Portuguese samples differ by the higher content of macro elements, highlighting P4 on the positive end of F1, so that could be seen as an atypical sample. In previous work reported by [10] values of K > 2000 mg/kg were also verified in floral honey of Argentina [10]. Other authors reported similar values for unifloral and multifloral honey from other geographic regions [22]. The F2 factor allows differentiating significantly (p<0.05) honey from Angola and Argentina. The variables of greater influence for F2 were Cu and Na along with the moisture content.
Cu content was employed by other authors, as a discriminator in honey of Argentina [10, 13]. The honey of Angola could be differentiated by the moisture content which is influenced by the botanical origin, and also due to the processing and extraction of an incipient and artisanal activity. However other authors also employed humidity as an indicator of the origin of honey [10, 13, 23].
The F3 factor allows characterizing significantly (p<0.05) honey from Portugal due to its content of Ca, and Zn, (Fig. 1b). The Ca content is within the range reported for honey from Portugal [40].
Therefore, the mineral content has a higher importance than the physicochemical parameters in the differentiation of honey because of by the greater variability they present concerning the geographical origin. Other authors who worked simultaneously with physicochemical data and mineral content also agree that the latter has a more significant relationship with the geographical origin [10, 31].
3.4. Hierarchical Cluster Analysis (HCA)
Fig. 2 shows a dendrogram generated by the hierarchical classification obtained by Ward’s method applied to the honey data. According to the dendrogram, the samples of Angola are grouped and separated from the honey of Argentina and Portugal. The latter present similarities in their variables that make their separation difficult, although at the lower levels of the dendrogram, it was possible to observe three different groups corresponding to honey from Portugal and Argentina. The two groups of honey from Argentina have presented differences; this could be related to its botanical origin since the HCA has been an effective tool for differentiating honey regarding its botanical origin [13]. Due to its particular geographical extension, Argentina presents diverse beekeeping regions that are differentiated by flora, soil, and other factors influencing the characteristics of the produced honey [32]. Within this classification, two samples, P4 and A11, appear grouped incorrectly with the honey from Argentina and Angola, respectively. According to the PCA, samples P4 and A11 should be overlapped according to F2 and F3 variables, Fig. 1.
The clusters obtained for the studied honeys by the HCA, confirm the grouping tendency observed in the PCA. Therefore, both non-supervised methods showed the differentiation of the honey according to their geographical origin. Other authors have reported that the mineral content is more related to the geographical origin of the honey than the chemical parameters or any other employed parameters [11, 13, 24]. Therefore, the mineral content is suitable to be employed as a discriminatory parameter to classify the honey as such indicator is not affected by the uncertainty of the analytical methods, by its high variability related to the natural origin of the samples under evaluation.

Figure 2. Dendrogram from Hierarchical Cluster Analysis
applied to the physicochemical data and minerals of honey.
Argentina (A), Portugal (P) and Angola (An).
4. Conclusions
The quality control of analytical methods is valuable information and must be considered since it allows for ensuring the reliability and traceability of analytical data. The physicochemical parameters play a major role in the determination of the quality and authenticity of the honey and the minerals content are complementary parameters in the honey characterization. The physicochemical parameters along with the mineral profile of the multifloral honey from 3 different regions were related by the chemometric methods to their geographical origin. The exploratory chemometric methods such as PCA and HCA showed a clustering or separation of the corresponding honeys according to their geographical origin.
In summary, the chemometric methods applied to the mineral data complemented with the physicochemical parameters showed their aptitude as tools for the differentiation of the honey according to their natural origin. The honey composition data from Jujuy-Argentina generated in this study will be incorporated into the LATINFOODS Portal database, Chapter ARGENFOODS. To do this, they will be completed with the determination of components such as amino acids, oligosaccharides, and others.
Authors’ contributions
Conceptualization, F.R., N.S., I.C. and M.L.; Methodology, F.R., I.D., A.N.; Software, F.R.; Validation, F.R., N.S. and M.L.; Formal Analysis, F.R., I.D., A.N. and M.L.; Investigation, F.R., I.D, A.N, and N.S., Resources, F.R. and M.L., I.C.; Data Curation, F.R.; Writing – Original Draft Preparation, F.R., I.C. and N.S.; Visualization, F.R, M.L., I.C. and N.S.; Supervision, F.R, I.C. and N.S.
Acknowledgements
This work was supported by the National Council of Scientific and Technical Research (CONICET)- and SECTER - National University of Jujuy, Argentina.
Funding
This research received no specific grant from any funding agency.
Availability of data and materials
All data will be made available on request according to the journal policy.
Conflicts of interest
The authors declare no conflict of interest.
References
1.
Gallego-Picó, A.; Garcinuño-Martínez, R.M.;
Fernández-Hernando, P. Honey authenticity and traceability. In Comprehensive
Analytical Chemistry, 1st Edn. Elsevier, Oxford, UK, 2013, 511-541.
2.
Johnson, D.W.; Badve, S.V.; Pascoe, E.; Beller, E.;
Cass, A.; Clark, C.; de Zoysa, J.; Isbel, N.M.; McTaggart, S.; Morrish, A.T.;
Playford, E.G.; Scaria, A.; Snelling, P.; Vergara, L.A.; Hawley, C.M. Antibacterial
honey for the prevention of peritoneal-dialysis-related infections (HONEYPOT):
a randomised trial. Lancet Infect Dis. 2014, 14(1), 23-30. https://doi.org/10.1016/S1473-3099(13)70258-5
3.
Grigoryan, K. Safety of Honey. In: Regulating Safety
of Traditional and Ethnic Foods, 1 st Edn. Elsevier, Oxford, UK, 2016, 217-246.
4.
Bueno-Costa, F.M.; Zambiazi, R.C.;
Bohmer, B.W.; Chaves, F.C.; da Silva, W.P.; Zanusso, J.T.; Dutra, I. Antibacterial
and antioxidant activity of honeys from the state of Rio Grande do Sul, Brazil.
LWT - Food Sci Technol. 2016, 65, 333-340. https://doi.org/10.1016/j.lwt.2015.08.018.
5.
Gannabathula, S.; Krissansen, G.W.; Bisson-Rowe, L.;
Skinner, M.; Steinhorn, G.; Schlothauer, R. Correlation of the
immunostimulatory activities of honeys with their contents of identified bioactives.
Food Chem. 2017, 221, 39-46. https://doi.org/10.1016/j.foodchem.2016.10.038.
6.
Zhang, C.R.; Dissanayake, A.A.; Nair, M.G.
Functional food
property of honey locust (Gleditsiatriacanthos) flowers. J Funct Foods. 2015, 18,
266-274. https://doi.org/10.1016/j.jff.2015.07.012
7.
de Alda-Garcilope, C.; Gallego-Picó, A.; Bravo-Yagüe,
J.C.; Garcinuño-Martínez, R.M.; Fernández-Hernando, P. Characterization of
Spanish honeys with protected designation of origin “Miel de Granada” according
to their mineral content. Food Chem. 2012, 135(3), 1785-1788. https://doi.org/10.1016/j.foodchem.2012.06.057.
8.
Solayman, M.; Islam, M.A.; Paul, S.; Ali, Y.; Khalil,
M.I.; Alam, N.; Gan, S.H. Physicochemical Properties, Minerals, Trace Elements,
and Heavy Metals in Honey of Different Origins: A Comprehensive Review. Compr.
Rev. Food Sci. Food Saf. 2016, 15 (1), 219-233. https://doi.org/10.1111/1541-4337.12182.
9.
Silvano, M.F.; Varela, M.S.; Palacio, M.A.;
Ruffinengo, S.; Yamul, D.K. Physicochemical parameters and sensory properties of
honeys from Buenos Aires region. Food Chem. 2014, 152, 500-507. https://doi.org/10.1016/j.foodchem.2013.12.011.
10. Conti, M.;
Finoia, M.; Fontana, L.; Mele, G.; Botrè, F.; Iavicoli, I. Characterization of
Argentine honeys on the basis of their mineral content and some typical quality
parameters. Chem. Cent. J. 2014, 8(1), 1-10. https://10.1186/1752-153X-8-44
11. Patrignani, M.;
Bernardelli, C.; Conforti, P.A.; Malacalza, N.H.; Yamul, D.K.; Donati,
E.; Lupano, C.E. Geographical discrimination of honeys through
antioxidant capacity, mineral content and colour. Int. J. Food Sc.i Technol.
2015, 50(12), 2598-2605. https://doi.org/10.1111/ijfs.12928.
12. Baroni, M.; Arrua,
C.; Nores, M.; Fayé, P.; del Pilar Díaz, M.; Chiabrando, G.A.;
Wunderlin, D.A. Composition of honey from Córdoba (Argentina):
Assessment of North/South provenance by chemometrics. Food Chem. 2009, 114(2),
727-733. https://doi.org/10.1016/j.foodchem.2008.10.018.
13.
Pellerano, R.G.; Uñates, M.A.;
Cantarelli, M.A.; Camiña, J.M.; Marchevsky, E.J. Analysis of trace elements in
multifloral Argentine honeys and their classification according to provenance. Food Chem. 2012, 134(1), 578-582. https://doi.org/10.1016/j.foodchem.2012.02.125.
14.
Di Bella, G.; Lo Turco, V.; Potortì, A.G.; Bua, G.D.;
Fede, M.R.; Dugo, G. Geographical discrimination of Italian honey by
multi-element analysis with a chemometric approach. J. Food. Comp. Anal. 2015, 44, 25-35. https://doi.org/10.1016/j.jfca.2015.05.003.
15. Batista, B.L.; Da
Silva, L.R.S.; Rocha, B.A.; Rodrigues, J.L.; Berretta-Silva, A.A.; Bonates, T.O.;
Gomes, V.S.D.; Barbosa, R.M.; Barbosa, F. Multi-element determination in Brazilian honey samples
by inductively coupled plasma mass spectrometry and estimation of geographic
origin with data mining techniques. Food Res. Int. 2012, 49(1), 209-215. https://doi.org/10.1016/j.foodres.2012.07.015.
16. Yücel, Y.;
Sultanoğlu, P. Characterization of Hatay honeys according to their
multi-element analysis using ICP-OES combined with chemometrics. Food Chem.
2013, 140(1-2), 231-237. https://doi.org/10.1016/j.foodchem.2013.02.046.
17. Vandeginste,
B.G.M.; Rutan, S.C. Handbook of Chemometrics and Qualimetrics, Part B.
Elsevier, Amsterdam, 2000.
18. Gemperline, P.
Practical Guide to Chemometrics, 2nd Edn., CRC/Taylor & Francis,
2006.
19. Barbosa, R.M.;
de Paula, E.S.; Paulelli, A.C.; Moore, A.F.; Souza, J.M.O., Batista, B.L.;
Campiglia, A.D.; Barbosa Jr.F. Recognition of organic rice samples based on
trace elements and support vector machines. J Food Comp. Anal. 2016, 45, 95-100.
https://doi.org/10.1016/j.jfca.2015.09.010.
20.
Gaiad, J.E.; Hidalgo, M.J.; Villafañe, R.N.;
Marchevsky, E.J.; Pellerano, R.G. Tracing the geographical origin of
Argentinean lemon juices based on trace element profiles using advanced
chemometric techniques. Microchem. J. 2016, 129, 243-248. https://doi.org/10.1016/j.microc.2016.07.002.
21. Marcelo, M.C.A.;
Martins, C.A.; Pozebon, D.; Dressler, V.L.; Ferrão, M.F. Classification of
yerba mate (Ilex paraguariensis) according to the country of origin based on
element concentrations. Microchem. J. 2014, 117, 164-171. https://doi.org/10.1016/j.microc.2014.06.027
22. Habib, H.M.; Al
Meqbali, F.T.; Kamal, H.; Souka, U.D.; Ibrahim, W.H. Physicochemical and
biochemical properties of honeys from arid regions. Food Chem. 2014, 153, 35-43.
https://doi.org/10.1016/j.foodchem.2013.12.048
23. Lazarević, K.B.;
Andrić, F.; Trifković, J.; Tešić, Ž.; Milojković-Opsenica, D. Characterisation
of Serbian unifloral honeys according to their physicochemical parameters. Food
Chem. 2012, 132(4), 2060-2064. https://doi.org/10.1016/j.foodchem.2011.12.048.
24. Alves, A.;
Ramos, A.; Gonçalves, M.M.; Bernardo, M.; Mendes, B. Antioxidant activity,
quality parameters and mineral content of Portuguese monofloral honeys. J. Food
Comp. Anal. 2013, 30(2), 130-138. https://doi.org/10.1016/j.jfca.2013.02.009.
25. Can, Z.; Yildiz,
O.; Sahin, H.; AkyuzTurumtay, E.; Silici, S.; Kolayli, S. An investigation of
Turkish honeys: Their physico-chemical properties, antioxidant capacities and
phenolic profiles. Food Chem. 2015, 180, 133-141. https://doi.org/10.1016/j.foodchem.2015.02.024.
26. Flanjak, I.;
Kenjerić, D.; Bubalo, D.; Primorac, L. Characterisation of selected Croatian
honey types based on the combination of antioxidant capacity, quality
parameters, and chemometrics. Eur. Food Res. Technol. 2016, 242(4), 467-475. https://doi.org/10.1007/s00217-015-2557-0.
27. Nayik, G.A.;
Nanda, V. Physico-Chemical, Enzymatic, Mineral and Colour Characterization of
Three Different Varieties of Honeys from Kashmir Valley of India with a
Multivariate Approach. Polish J. Food Nutr. Sci. 2015, 65(2), 101-108. http://journal.pan.olsztyn.pl
28. Petretto, G.L.;
Cossu, M.; Alamanni, M.C. Phenolic content, antioxidant and physico-chemical
properties of Sardinian monofloral honeys. Int. J. Food Sci. Technol. 2015, 50(2),
482-491. https://doi.org/10.1111/ijfs.12652.
29. Manzanares, A.;
García, Z.; Galdón, B.; Rodríguez, E.; Romero, C. Physicochemical
characteristics of minor monofloral honeys from Tenerife, Spain. LWT - Food Sci
Technol. 2014, 55(2), 572-578. https://doi.org/10.1016/j.lwt.2013.09.024.
30. Mbaeyi-Nwaoha,
I.; Juliet, N.; Chinwendu, O. Quality assessment of yoghurt formulated with
aqueous extract of Roselle calyx, Moringa leaf and Lemon grass. J. Agric. Food
Sci. Biotechnol. 2023, 1(2), 128-139. https://doi.org/10.58985/jafsb.2023.v01i02.15.
31. Karabagias, I.K.;
Louppis, A.P.; Karabournioti, S.; Kontakos, S.; Papastephanou, C.; Kontominas,
M.G. Characterization and geographical discrimination of commercial Citrus spp.
honeys produced in different Mediterranean countries based on minerals,
volatile compounds and physicochemical parameters, using chemometrics. Food
Chem. 2017, 217, 445-455. https://doi.org/10.1016/j.foodchem.2016.08.124.
32. Rios, F.; Sanchez,
A.C.; Lobo, M.; Lupo, L.; Coelho, I.; Castanheira, I.; Samman, N. A
chemometric approach: characterization of quality and authenticity of artisanal
honeys from Argentina. J. Chemom. 2014, 28(12), 834-843. https://doi.org/10.1002/cem.2654.
33. Karabagias, I.K.;
Badeka, A.; Kontakos, S.; Karabournioti, S.; Kontominas, M.G. Characterization
and classification of Thymus capitatus
(L.) honey according to geographical origin based on volatile compounds,
physicochemical parameters and chemometrics. Food. Res. Int. 2014, 55, 363-372.
https://doi.org/10.1016/j.foodres.2013.11.032.
34. Codex
Alimentarius Commission. Standard for Honey. 2022. Available on:
https://www.fao.org/fao-who-codexalimentarius/shproxy/en (accessed on 10th
January, 2023).
35.
Portela, M.L. Vitaminas y Minerales en Nutrición,
2nd Ed., La Prensa Médica Argentina, Buenos Aires, 2003.
36. Zakaridja, S.;
Mariam, K.; Pingawindé, S.; Zakaria, K.; Pauline, B.K. Evaluation of the
mineral composition of four species of the Corchorus spp genus consumed as
leafy vegetables in Burkina Faso. J. Agric. Food Sci. Biotechnol. 2023, 1(3),
196-202. http://dx.doi.org/10.58985/jafsb.2023.v01i03.23.
37. Coelho, I.;
Gueifão, S.; Matos, A.S.; Roe, M.; Castanheira, I. Experimental approaches for
the estimation of uncertainty in analysis of trace inorganic contaminants in foodstuffs
by ICP-MS. Food Chem. 2013, 141(1), 604-611. https://doi.org/10.1016/j.foodchem.2013.03.040.
38. Medina, J.L.;
Boqué, R.; Ferré, J. Bagged, k-nearest neighbors’ classification with
uncertainty in the variables. Anal Chim. Acta. 2009, 646(1-2), 62-68. https://doi.org/10.1016/j.aca.2009.05.016.
39. Association of
Official Analytical Chemists. Official Methods of Analysis, 22nd Edn,
Washington, D.C., 2023Lebart, L.; Morineau, A.; Piron,
M. Statistique exploratoire multidimensionnelle, Dunod, Paris, 1995, 177-184.
40. Almeida-Silva, M.; Canha, N.; Galinha, C.; Dung, H.M.; Freitas, MC; Sitoe, T. Trace elements in wild and orchard honeys. Appl. Radiat. Isot. 2011, 69(11), 1592-1595. https://doi.org/10.1016/j.apradiso.2011.01.013.
This work is licensed under the
Creative Commons Attribution
4.0
License (CC BY-NC 4.0).
Abstract
The proximal and mineral profiles of multi floral honeys
from different geographic regions were determined and related to their origin. Moisture,
°Brix sugars, ash, pH, free acidity, water activity (aw) and
minerals content were determined by AOAC methods. In the exploratory analysis, non-supervised
chemometric methods were applied to build classification rules and relate the
origin of the samples based on their physicochemical parameters and mineral
content. The means of the physicochemical parameters obtained were °Brix-sugars
(82.44±1.68%), moisture (16.49±1.19%), pH (3.97±0.22), free acidity (24.07±6.79
meq/kg), aw (0.59±0.02), ash (0.24±0.11%). These values
demonstrate the high quality of the honey analyzed. Among the minerals, K was
the most abundant in all samples, ranging between 363.26-2034.11 mg/kg followed
by P (45.43-115.63 mg/kg), while Cu was the least abundant (0.18-2.02 mg/Kg).
The results showed differences in composition and mineral profile between
honeys from different regions. The first three factors of the Principal Component
Analysis method explained more than 67% of the variance and minerals had the
highest discriminatory power, while hierarchical cluster analysis successfully
classified the honey samples. The results show that mineral content is a capable
geographical indicator to identify the origin of honey and the use of
chemometric methods with proximal analysis and mineral content could be applied
to determine the quality and authenticity of honey.
Abstract Keywords
Honey,
physicochemical parameters, mineral profile, geographical origin, chemometric
methods, Argentina.
This work is licensed under the
Creative Commons Attribution
4.0
License (CC BY-NC 4.0).


This work is licensed under the
Creative Commons Attribution 4.0
License.(CC BY-NC 4.0).