

Research Article
Received: 2026-02-15 | Revised:2026-05-04 | Accepted: 2026-05-07 | Published: 2026-06-05
Pages: 146-157
DOI: https://doi.org/10.58985/jafsb.2026.v04i02.99
Abstract
This study evaluated the effects of fish farming
effluents and a biofertilizer on the growth of soybean (Glycine max) in
an integrated system combining the aquaculture of African catfish (Clarias
gariepinus) with soybean cultivation. Fish culture water, rich in
nutrients from fish metabolism and excretion, constitutes a valuable resource
for crop irrigation, reducing the dependency on synthetic fertilizers. Three
irrigation treatments were compared: fish culture water, biofertilizer, and tap
water used as a control. The effects of these treatments on soybean growth
(number of leaves, collar diameter, stem length and yield), physicochemical
parameters of water and soil, as well as on fish growth performance were
analyzed. The results revealed significant differences among the treatments.
Irrigation with fish culture water induced the best vegetative growth and the
highest yield, due to its richness in major nutrients (nitrogen, phosphorus and
potassium). Tap water also promoted plant height growth, whereas the
biofertilizer produced the lowest performance in this regards. The
physicochemical parameters of the water, particularly pH, ranged from 6 to 9
and temperature varied between 28 and 30 °C, remaining within the optimal
ranges for fish development. Similarly, for plants, a temperature of 25 to 30
°C and pH of 6.2 to 6.8 were maintained under conditions favorable for growth.
Statistical analyses (ANOVA and PCA) confirmed significant differences among the
treatments. Clarias gariepinus exhibited rapid growth (>
2%/day) and a high survival rate (99.14%). The results demonstrated that the
reuse of fish culture water for soybean irrigation represents a viable
agroecological approach that contributes contributing to improved agricultural
productivity, reduced fertilization costs, and sustainable valorization of
aquaculture effluents.
Keywords
Fish culture water, biofertilizer, growth, soybean, catfish, survival.
1. Introduction
Fishing
occupies a central place in the national economy, food security, and livelihood
of Senegal. The fisheries sector contributes 3.2 percent to Senegal's gross
domestic product (GDP), accounts for 10.2 percent of national exports, and
generated $ 400 million in value in 2021. It generates around 53,000 direct
jobs and over half a million indirect jobs, mainly in artisanal fishing and
processing [1]. However, marine catche has
stagnated over the past. Overfishing and illegal, unreported, and unregulated
(IUU) fishing have led to depleted fish stocks, while coastal demersal stocks
with high market value remain fully exploited or even overexploited. Fishing
pressure on locally consumed small pelagic fish is increasing, creating a serious
risk of supply shortages in the local market [2].
These cumulative pressures have major economic and social repercussions,
notably the reduction in fish availability for domestic consumption.
In
response to the scarcity of marine resources, the Government of Senegal has, committed
to promoting aquaculture since 2006, which is considered a sustainable strategy
to increase the national production of aquatic products, strengthen food
security, and generate employment. At the global level, aquaculture production
reached record levels in 2022. For the first time in history, aquaculture
production of aquatic animals surpassed capture fisheries production: of the
185 million tons of aquatic animals produced in 2022, 51 percent (94 million tons)
came from aquaculture and 49 percent (91 million tons) from capture fisheries [3],
marking a major milestone in the transformation of global aquatic food systems.
This trend highlights the need to develop sustainable, resilient, and
integrated aquaculture value chain.
In
Senegal, although the contribution of aquaculture to total fish production
remains modest compared to major producing countries in Asia, the sector has
experienced steady growth and is now among the priorities of public policy and
development programs. Institutions such as the World Bank and FAO support the
modernization of aquaculture value chains, sustainable management of resources,
and integration of agricultural and fish farming activities to optimize local
synergies.
However,
the development of aquaculture poses environmental challenges, particularly
pollution of aquatic and terrestrial ecosystems by farming effluents. Of the
total nutrients supplied to production ponds, only 30% are converted into
products, while the rest is usually discharged into the environment, altering
the physicochemical characteristics of the receiving water [4].
From a sustainability perspective, aquaculture integrated with agriculture is appears
to be a promising alternative. This concept, based on agroecological
principles, aims to reuse fish farming effluents as natural fertilizers. Pond-based
aquaculture–agriculture integration has been demonstrated to yield many social,
economic, and environmental benefits and is recognized as a proficient
utilization of water that aids food sustainability [5].
In such systems, nutrient-rich waters from fish ponds are used to irrigate and
fertilize vegetable crops, thereby promoting nutrient recycling and reducing
the environmental impact of farming systems. Integrated
aquaculture–agriculture, where aquatic and terrestrial foods are grown together
on the same plot, has been widely promoted to enhance production diversity,
land productivity, and nutrient cycling on farms [6].
Within
this framework, the present study was conducted, focusing on the integration
of Clarias gariepinus farming with soybean (Glycine max)
cultivation. The choice of soybean was based on its high demand in the national
market and the absence of local production. This study aimed to evaluate the
zootechnical performance of C. gariepinus and the effects of
fish culture water and a biofertilizer on soybean growth.
2. Materials and methods
2.1.
Fish production
The
African catfish (C. gariepinus) used in this study were reared in a
concrete tank of 9.62 m length and 4.77m width, and 42.63 m3 of
volume filled with dechlorinated tap water (from SENEAU, national water
supplier) to a depth of 0.60 m. During the experiment, 816 juveniles obtained
from the UCAD hatchery, with an initial mean weight of 10 g were stocked in a concrete
tank. Throughout the experiment, physicochemical parameters, such as
temperature and pH, were measured twice daily using a YSI ProQuatro device, in
the morning at 09:00 and in the afternoon at 16:00, before feeding. Fish were
fed twice a day with commercial feed (size of 3mm, crude protein 44%, and crude
fat 12%, Naturalleva, Italy) at a daily ration corresponding to 8% of their
live weight. A control harvest was carried out each month taking three (3)
samples of 30 individuals, this allowed the assessment of changes in biomass. The
duration of the experiment was 10 weeks (03.07.2024 and 18.09.2024).
Measurements taken on the individuals during control harvests were used to
assess growth performance and feed efficiency parameters.
2.2.
Calculation of growth and feed efficiency parameters.
The
formulas used are as follows standard procedures [7]:
·
Absolute Mean Weight Gain (AMWG) (g)
= Final Mean Weight (FMW) (g) - Initial Mean Weight (IMW) (g).
· Relative
Mean Weight Gain (RMWG) (%) = (Final Mean Weight (g) - Initial Mean Weight (g))
x 100/ Initial Mean Weight (g).
· Specific
Growth Rate (SGR) (%/day) = [ln (final weight) - ln (initial weight)] x 100 /
Period.
· Feed
conversion ratio (FCR) = Quantity of feed distributed/absolute weight gain.
· Survival
rate (SR) % = (final number of individuals / initial number of individuals) x 100.
2.3.
Measurement of physicochemical parameters of tank water
To
determine the temperature and pH of the tank water, a multifunctional device (YSI
ProQuatro) was directly immersed in the tank, and after stabilization, the
values were recorded in an Excel spreadsheet. These measurements were taken
twice daily (morning at 9 am and evening 4 pm). For chemical parameters
(ammonia, nitrite and nitrate), a water sample collected from the tank was
placed in a plastic test tube, and strip of the 7-parameters test kit (purchased
from China) was immersed in it. After 30 s, the colored strip was removed, and
the results were interpreted according to the color reference provided on the
kit packaging.
2.4.
Bioferlizer for growth and flowering
The
biofertilizer used was BF2 HYFER, produced by Biotech Service Senegal in Dakar.
It is a foliar fertilizer rich in macro- and micronutrients, are suitable for
all types of crops (cereals, vegetable crops, fruit trees, and flowers).
BF2
HYFER GREEN (NPK: 22–11–9) was applied during the vegetative stage. For
application, one tea glass of 80 mL of the product was diluted in a 16 L
sprayer filled with clean water. The product was thoroughly shaken before being
diluted. Applications were carried out every 15 days, preferably early in the
morning or late in the afternoon, from 7 to 15 days after transplanting or
emergence until the onset of flowering.
BF2
HYFER RED (NPK: 8–16–24), used during the finishing stage, was applied from the
beginning of flowering at the same rate. The method of application was
identical: dilution in clean water, shaking before use, and spraying.
Treatments were also performed every 15 days, preferably early in the morning
(around 7 a.m.).
2.5.
Soy production
An
area of 32 m² was weeded and subdivided into nine plots. Measurements were
taken using a measuring tape to mark the plots (2.15 m in length and 1.20 m in
width for each plot). Planting holes were dug, and bunds were raised along the
sides of each plot. Each plot contained 12 plants, spaced 25 cm between plants
and 80 cm between rows.
The
random distribution was as follows:
-Plots
1, 4, and 7 were treated with aquaculture water.
-Plots
2, 5, and 8 were treated with biofertilizer.
-Plots
3, 6, and 9 were treated with tap water (control).
2.6.
Measurement of plant growth parameters
During
this experiment, data were collected every 15 days: the number of leaves was
counted by counting; stem length was measured using a graduated ruler; and
collar diameter was measured using a caliper.
2.7.
Measurement of soil physicochemical parameters
The
parameters investigated were pH, temperature, and concentrations of ammonia,
nitrite, and nitrate. These measurements were taken every 15 days using a
seven-parameter test kit imported from China.
To
measure the concentrations of ammonia, nitrite, nitrate, and pH in each plot,
sand samples were collected from the four corners and the center, and placed in
containers. The sand was subsequently mixed with distilled water in equal
proportions. After agitation, the mixture was allowed to rest and settle until
a supernatant was obtained, which was collected and transferred into test
tubes. Next, a test strip was immersed in each tube for 30 s, removed for
reading, and the coloration of the strip was interpreted according to the
reference standard indicated on the kit packaging.
For
the measurement of ammonia concentration, a test strip was immersed in each
tube containing water from the tank and the plots for 30 s, followed by an
additional immersion of 3 min before reading the result according to the color
standard indicated on the box.
Soil
temperature was measured using a digital thermometer (CHENG ER TONG) inserted
into the soil, and the indicated value was recorded after the temperature
stabilized.
2.8.
Yield evaluation
Yield
is the total production obtained per unit area (kg/m²). It is calculated using
the following formula:
Yield = production(kg)/ cultivated area (m2).
2.9.
Statistical analyses
The
collected data were analyzed using R software and Excel. An analysis of
variance (ANOVA) was performed to compare the treatments, followed by a mean
comparison using Tukey’s test and Principal Component Analysis (PCA). A
significance level of 5% was set. Differences were considered significant at P
< 0.05.
3. Results
After 10 weeks of experimentation, results were obtained regarding growth parameters as well as the physicochemical parameters of the soil and pond.
3.1.
Physicochemical parameters of pond water
The analysis of Table 1 shows that the mean water temperature ranged from 29.86 ± 1.7 °C in the morning to 31.58 ± 1.3 °C in the evening. The mean water pH values varied between 7.098±1.08 in the morning and 7.626 ± 1.2 in the evening, indicating that the water was generally neutral to slightly alkaline.
Table 1. Variation in water temperature and ph of the pond.
Parameter | Morning temp. | Evening temp. | Morning pH | Evening pH |
Mean temperature | 29.86 ± 1.7a | 31.58 ± 1.3a | 7.098 ± 1.08a | 7.626 ± 1.2a |
Letters a in superscript indicate that there is no statistically significant difference (P > 0.05). | ||||
3.1.2. Fish growth parameters
The analysis of Table 2 shows an increase in the average body weight of the fish, rising from 10 g to 186.89 g (mean weight gain: 176.89 g). The specific growth rate was 2.61% per day.
The number of individuals remained relatively stable throughout the rearing cycle, with a survival rate of 99.14%. The feed conversion ratio (FCR) was calculated as 1.56.
The growth performance results are presented in Table 2. After 10 weeks of rearing, the mean final weight was 186.89 g; weight gain was 176.89 g; specific growth rate was 2.61% per day; feed conversion ratio was 1.56; and fish survival rate was 99.14%.
Table 2. Fish growth parameters.
IMW (g) | FMW (g) | AMWG (g) | RMWG (%) | SGR (% /day) | FCR | SR (%) |
10 ± 1.2 | 186.89 ± 3 | 176.89 ± 2.01 | 1768.9 ± 4 | 2.61 ± 0.8 | 1.56 ± 0.3 | 99.14 ± 0.05 |
3.1.3. Plant growth
parameters
The analysis shown in Fig. 1 shows a significant variation (p < 0.05) in the number of leaves depending on the treatment. Plants irrigated with fish pond water exhibited a significantly higher number of leaves (a) than those treated with the biofertilizer (b). Tap water occupied an intermediate position (ab), and showed no statistically significant difference from the other two treatments.

Figure 1. Changes in Leaf number according to treatments.
Fig.2 illustrates the evolution of stem length under the different treatments (biofertilizer, tap water, and fish pond water). Statistical analysis showed that all treatments shared the same letter (a), indicating the absence of a significant difference among treatments (p > 0.05). Stem length tended to be slightly higher in plants irrigated with fish pond water, however, this variation remained non-significant due to the high intra-group variability highlighted by the error bars. Similarly, plants treated with biofertilizer and tap water exhibited comparable stem lengths. These results suggest that, unlike leaf number, where fish pond water proved to be more favorable, stem length was not significantly influenced by the type of treatment.

Figure 2. Changes in stem length according to treatments.
Fig. 3 presents the changes in collar diameter according to the treatment. Unlike leaf number, no significant difference was observed among the three treatments, as all treatments shared the same letter (a). Although plants irrigated with fish pond water exhibited a slightly higher mean value, this difference was not statistically significant due to the high variability observed. Consequently, the use of fish pond water did not lead to a clear improvement in collar thickening compared with the other treatments. Collar diameter, an indicator of plant robustness and structural strength, appears to be less influenced by the nature of the treatments.

Figure 3. Changes in collar diameter according to treatments.
3.1.4.
Physicochemical parameters of the soil used for plant cultivation
Fig. 4 shows the changes in ammonia concentration under the three treatments (biofertilizer, tap water, and fish pond water) over a ten-week period. It was observed that ammonia levels remained low and below 2 mg/L, with variations depending on the water type and sampling period.
During the 2nd and 4th weeks, ammonia concentrations were similar among the treatments, with no significant differences. From the 6th week onward, fish pond water was characterized by a gradual increase in ammonia concentration, whereas the biofertilizer and tap water treatments remained at lower levels. This trend was confirmed in the 8th week, with a marked increase observed in the fish pond water treatment. By the 10th week, although fish pond water maintained relatively higher values, an increase was also noted in the biofertilizer treatment, whereas tap water remained stable and exhibited low ammonia concentrations.

Figure 4. Evolution of ammonia concentration.
Fig. 5 presents the changes in nitrite concentrations for the three treatments between the 2nd and the 10th weeks. The levels were initially low and similar in the 2nd week, reflecting a balanced state of the environment. A progressive increase was observed up to the 6th week, with higher values in the treatment based on fishpond water, indicating more intense nitrification activity. The peak recorded in the 6th week corresponded to high microbial activity, notably the oxidation of ammonium into nitrites.
From the 8th week onward, concentrations gradually, decreased reaching values at the 10th week close to those observed at the beginning of the experiment, indicating a rebalancing of the nitrogen cycle. Overall, the dynamics followed a bell-shaped curve characteristic of the nitrification process, with an initial low phase, a transient accumulation phase, and a declining phase associated with the conversion of nitrites to nitrates and their assimilation by plants. Nevertheless, fishpond water treatment stands out due to generally higher concentrations, although all treatments tend toward a comparable final equilibrium.

Figure 5. Changes in nitrite concentration.
Fig. 6 illustrates the evolution of nitrate concentrations in the three treatments over a ten-week period. At week 2, the values were similar across all treatments (10 mg/L), indicating homogeneous initial conditions. From week 4 onward, fish water exhibited a marked increase in nitrate levels, in contrast to the biofertilizer and tap water treatments, which remained at lower concentrations, reflecting a rapid release of organic nitrogen in fish water. By week 6, maximum concentrations were observed in the biofertilizer and fish water treatments, whereas tap water remained relatively stable. At week 8, a decrease in nitrate concentrations was recorded for the biofertilizer and tap water treatments, whereas fish water maintained high values, indicating ongoing nitrification processes. By week 10, the nitrate concentrations converged again to approximately again 10 mg/L, reflecting the re-establishment of nitrogen cycle equilibrium. Overall, fish water generated the highest concentrations and most pronounced fluctuations, the biofertilizer showed a gradual release of nitrates, and tap water was characterized by low and stable concentrations. These results highlight the influence of treatment type on nitrate dynamics, particularly during the early weeks, prior to the final stabilization of the system.

Figure 6. Changes in nitrate concentration.
Fig. 7 illustrates the evolution of soil temperature in the cultivation beds under different treatments. Overall, a gradual decrease in temperature was observed over time for all treatments.
Beds treated with the biofertilizer exhibited the highest temperatures at the beginning of the experiment, reaching approximately 35 °C by week 2, before progressively declining to about 28 °C by week 10. Beds irrigated with tap water showed a similar trend, with initial values slightly lower than those recorded for the biofertilizer treatment and final temperatures close to 28–29 °C. In contrast, beds treated with fish water consistently displayed lower temperatures, decreasing from approximately 31 °C in week 2 to around 25 °C in week 10.

Figure 7. Temperature variation.
Fig. 8 highlights the changes in soil pH under the different treatments over time. Soil treated with the biofertilizer showed a gradual increase in pH, rising from approximately 6.8 at week 2 to nearly 7.3 at week 10, indicating a trend toward neutralization of the medium associated with biofertilizer mineralization. Tap water treatment was characterized by high pH stability, remaining between 6.2 and 6.5 throughout the experimental period, confirming its neutral role and the absence of a significant influence on soil reaction. Fish water exhibited a moderate evolution, with pH increasing from 6.7 to about 6.8, suggesting slight alkalinization attributable to the organic and mineral compounds it contains.
Overall, soil pH remained relatively stable regardless of the treatment; however, biofertilizer and fish water promoted a slight neutralization of the medium, in contrast to tap water, whose effect was limited.

Figure 8. pH variation.
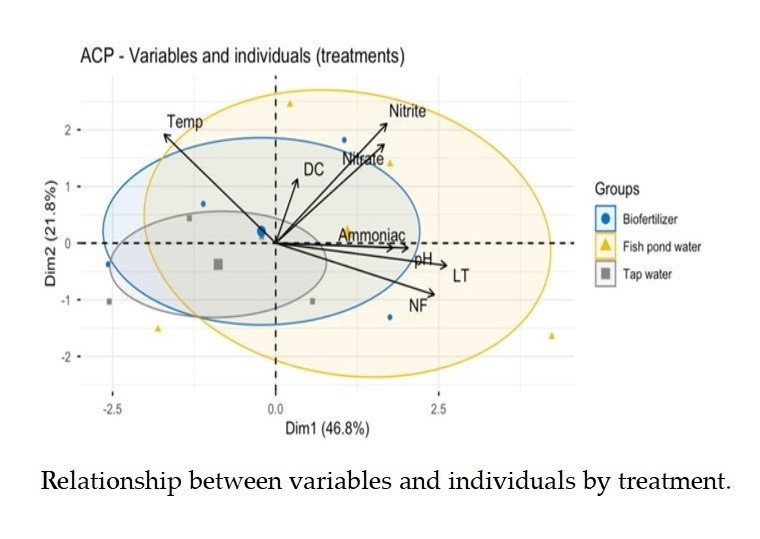
Fig. 9 presents the relationship between plant growth and physicochemical parameters for the different treatments.
The distribution of treatment was as follows:
Fish water (yellow ellipse):
· Mainly distributed in the upper part of the graph (positive Dim2).
· Associated with high nitrate and nitrite concentrations, indicating greater nutrient input.
Biofertilizer (blue ellipse):
· Predominantly located on the positive side of Dim1.
· Associated with high values of leaf number (LN) and stem length (SL), reflecting good vegetative growth.
Tap water (grey ellipse):
· Clustered on the negative side of Dim1.
· Mainly associated with higher temperature values, but with more limited growth (low SL and LN).

Figure 9. Relationship between variables and individuals by treatment.
The principal component analysis (PCA) revealed a clear differentiation among the treatments. The biofertilizer treatment clusters were on the positive side of axis 1, in association with a higher number of leaves (LN) and greater stem length (SL), indicating a favorable effect on vegetative growth. Fish water was mainly projected along axis 2, in correlation with high nitrate and nitrite concentrations, reflecting a strong mineral nutrient input. In contrast, tap water was more closely associated with temperature, and contributed less growth-related indicators. Overall, these results highlight that the treatments differentially influence plant development: biofertilizer enhances morphological growth, whereas fish water primarily enriches the environment with mineral nutrients.
3.1.5. Yields of harvested products
Table 3 presents the average yield recorded for the three treatments applied to the same cultivation area (7.74 m²). The fish culture effluent treatment resulted in a mean yield of 1.08 ± 0.46 kg/m², followed by the biofertilizer treatment (0.79 ± 0.31 kg/m²), while the tap water treatment showed a yield (0.72 ± 0.29 kg/m²).
Table 3. Yields of harvested products.
Treatment | Number of replicate | Mean yield (kg/m2) |
Fish culture effluents | 3 | 1.08 ± 0.46a |
Biofertilizer | 3 | 0.79 ± 0.31a |
Tape water | 3 | 0.72 ± 0.29a |
3.2. Statistical analysis
The statistical analysis indicated that these differences were not significant (p > 0.05), suggesting that the soybean yield did not differ significantly among the fish culture effluents, biofertilizer, and tap water treatments.
4. Discussion
The results obtained in this study indicate that the fish reached a final mean weight of 186.89 g, compared with an initial weight of 10 g, corresponding to an average relative weight gain of 1768.9% and a specific growth rate (SGR) of 2.61% per day. The survival rate was exceptionally high (99.14%), and the feed conversion ratio (FCR) was satisfactory (1.56). These performances are consistent with those reported by Lubna et al. [5] and confirmed by Ignowski et al. [6], who observed SGR values exceeding 2% per day and survival rates above 95% for Clarias gariepinus under semi-intensive culture conditions. Similarly, Hussain, et al. [7] reported an FCR of 1.6 and a survival rate of 98% for this species reared in ponds integrated with market gardening systems. Overall, these results confirmed that the robustness and zootechnical efficiency of Clarias gariepinus in integrated aquaculture–agriculture systems, particularly due to its tolerance to variations in water quality.
The temperature of the rearing pond ranged from 24.1 to 36.3 °C, consistent with the mean values recorded in the morning (29.86 ± 1.7 °C) and evening (31.58 ± 1.3 °C). The increase in temperature during the day was mainly explained by solar radiation and the shallow depth of the pond. However, no statistically significant difference (P > 0.05) was observed between the measurement periods, indicating relative thermal stability. These values fall within the optimal growth range reported by Teugels et al. [8] for Clarias gariepinus, suggesting that temperature was not a limiting factor in this study.
The pond pH varied between 6.06 and 9.48 with an average of 7.098 ± 1.08 in the morning and 7.626 ± 1.2 in the evening. These results are in line with the observations of Geoffroy et al. [9], who reported that Clarias gariepinus develops optimally in waters with pH values ranging from 6 to 9.
Regarding the dynamics of nitrogenous compounds, nitrate concentrations showed progressive accumulation up to approximately 25 mg/L, followed by stabilization. Nitrite levels exhibited a peak during the second week (10 mg/L), followed by a regular decline. Ammonia concentrations remained low, below 1.5 mg/L, reflecting the proper functioning of the fish production system and maintenance of satisfactory water quality. Indeed, Romanova et al. [10] reported that Clarias can tolerate ammonia concentrations on the order of 0.1 mg/L. Maintaining the observed values below this threshold explains the near-total survival rate.
Analysis of the applied treatments revealed different effects on plant growth parameters. Irrigation with fish water resulted in a significant increase in leaf number compared with biofertilizer irrigation, whereas tap water produced intermediate results. These findings suggest that fish water constitutes an effective nutrient source for stimulating foliar development. Several authors have highlighted that aquaculture effluents are rich in nitrogen (N), phosphorus (P), and potassium (K), which are essential for vegetative growth [11, 12]. In particular, nitrogen plays a fundamental role in protein synthesis and photosynthesis, thereby promoting leaf development [13].
In contrast, collar diameter did not differ significantly among the treatments. This parameter, often associated with plant robustness and mechanical stability, appears to be more strongly influenced by other environmental factors, such as sowing density, water availability, and climatic conditions. Similarly, stem length did not vary significantly, although a slight increasing trend was observed with fish water. This suggests that tissue elongation depends on complex physiological mechanisms that are not exclusively determined by the nutrient supply [14].
Thus, fish water exerts a marked positive effect on foliar development but has a more limited influence on structural parameters such as collar diameter and stem length. This difference may be explained by the differential redistribution of nutrients within the plant as leaves, as priority photosynthetic organs, benefit more from increased nutrient availability [15].
Final yields varied according to treatment, with 1.08 kg/m² for fish culture effluent, 0.79 kg/m² for the biofertilizer, and 0.72 kg/m² for tap water. However, despite the numerically higher value observed for fish culture effluents, this apparent superiority did not translate into a statistically significant improvement in soybean productivity. These results do not align with those of report [16] on cucumber, where plots irrigated with fish culture effluents achieved the highest yield (1.15 kg/m²). This may be due to the high variability within the treatments and the small experimental area. Environmental factors such as soil properties and climate could also have influenced the results. Additionally, lower nutrient concentrations or differences in application methods may have limited the treatment effectiveness.
The soil temperature also varied according to the treatment: with plots irrigated with fish pond water maintained lower temperatures (25 to 31 °C) than those treated with biofertilizer and tap water (28 to 35 °C). These values correspond to the optimal thermal conditions for soybean development. Recent studies have indicated that germination can begin at temperatures as low as 10 °C, however, an optimal range between 20 and 25 °C promotes rapid and uniform seedling emergence [17]. Zhang et al. [18] reported mean temperatures between 23 and 25 °C during the vegetative stage and mid-season, thermal conditions considered optimal for soybean growth and yield.
The soil pH also differed among the treatments. Plots irrigated with biofertilizer and fish water exhibited values close to neutrality (6.8–7.3), whereas those irrigated with tap water remained slightly acidic (6.2–6.5). Neutral pH conditions favor nutrient availability [19], which explains the better performance observed. Soils irrigated with fish water also showed the highest nitrate concentrations (25 mg/L at week 4), as well as elevated nitrite and ammonia levels. These results are consistent with those reported by Goudiaby et al. [20], who indicated that nitrate constitutes the main nutrient component of fish water, with average concentrations around 25 mg/L resulting from the mineralization of fish excreta. This level is consistent with the final stage of the nitrification cycle, during which nitrifying bacteria (Nitrobacter spp.) convert nitrites into nitrates. According to Severinn et al. [21], nitrates represent a highly assimilable form of nitrogen that promotes rapid vegetative development, particularly in nitrogen-demandcrops. Geoffroy et al. [9] also demonstrated that the use of nitrate-rich water in aquaponic systems significantly enhances leaf and root biomass, which may explain the higher yields observed with fish water.
Finally, the use of aquaculture effluents for crop fertilization fully aligns with a sustainable and circular agricultural approach. This allows both the valorization of aquaculture waste and the reduction of dependence on chemical fertilizers, which are often costly and environmentally harmful [22]. However, the effectiveness of these effluents may vary depending on their composition, the cultivated species, and the growing conditions, highlighting the need for further studies to optimize their use and agronomic impact.
5. Conclusions
This study assessed the integration of Clarias gariepinus aquaculture with soybean (Glycine max) cultivation in Senegal. Fish showed strong zootechnical performance and pond water maintained optimal physicochemical conditions. Agronomically, soybean plants irrigated with aquaculture effluents outperformed those receiving biofertilizer or tap water, confirming the value of this integrated system in reducing chemical inputs and enhancing the crop productivity. This approach supports circular, ecological, and resilient agri-food systems that are aligned with national and international sustainability goals. Future research should focus on longer trials, diversification of species, economic and environmental assessments, and exploration of decoupled aquaponics by combining soybean and maize.
Disclaimer (artificial intelligence)
Author(s) hereby state that no generative AI tools such as Large Language Models (ChatGPT, Copilot, etc.) and text-to-image generators were utilized in the preparation or editing of this manuscript.
Authors’ contributions
Methodology, data curation and formal analysis, R.G.; conceptualization, supervision, validation, writing, reviewing and editing, J.F.; writing original draft, reviewing, editing and formal analysis, A.N.; visualization and validation, N.C.M., D.M., M.B.
Acknowledgements
The authors don't have anything to acknowledge.
Funding
This research received no external funding
Availability of data and materials
All data will be made available on request according to the journal policy
Conflicts of interest
The authors declare no conflict of interest
References
1. | FAO. The state of world fisheries and aquaculture. Rome, 2023. https://faostat.fao.org. |
2. | CFFA—Coalition for Fair Fisheries Arrangements. Yellow card Senegal: the fight against IUU fishing, 2024. https://www.cffacape.org/publications-blog/yellow-card-senegal-the-fight-against-iuu-fishing-must-also-be-waged-in-the-coastal-zone. |
3. | FAO. The state of world fisheries and aquaculture 2024: Blue transformation in action. Rome, 2024. https://doi.org/10.4060/cd0683fr |
4. | Chiquito-Contreras, R.G.; Hernandez-Adam, L.; Alvarado-Castillo, G.; Martínez-Hernández, M.J.; Sánchez-Viveros, G.; Chiquito-Contreras, C.J.; Hernandez-Montie, L.G. Aquaculture—production system and waste management for agriculture fertilization—A review. Sustainability. 2022, 14, 7257. https://doi.org/10.3390/su14127257 |
5. | Lubna, A.I.; Abu-Hashim, M.; Shaghaleh, H.; Elsayed, E.; Hamad, A.A.A.; Hamoud, Y.A. A comprehensive review of the multiple uses of water in aquaculture-integrated agriculture based on international and national experiences. Water. 2023, 15, 367. https://doi.org/10.3390/w15020367 |
6. | Ignowski, L.; Belton, B.; Hazrat, A.; Shakuntala, H.T. Integrated aquatic and terrestrial food production enhances micronutrient and economic productivity for nutrition-sensitive food systems. Nature Food. 2023, 4, 866–873. https://doi.org/10.1038/s43016-023-00840-8 |
7. | Hussain, S.M.; Nisar, A.; Farhat, J.; Arshad, J.; Nosheen, A.; Majid, H.; Shahtaj, A.; Arsalan, M.Z.H.; Danish, R.; Shahzad, M.M. Effects of citric acid and phytase supplementation on nutrient digestibility and growth performance of Cirrhinus mrigala fingerlings fed on corn gluten (30%) meal-based diets. Int. J. Biosci. 2015, 6(7), 82-91. http://dx.doi.org/10.12692/ijb/6.7.82-9 |
8. | Teugels, G. A systematic revision of the African species of the genus Clarias (Pisces: Clariidae). Ann. Royal Museum Cent. Afr. 1986, 247, 1–199. |
9. | Geoffroy, E.O.; Cloud, H.L.; Bienvenu, G.A. Bibliographic synthesis on biological and zootechnical parameters of the African catfish Clarias gariepinus Burchell, 1822. Eur. Sci. J. 2019, 15(27), 54–68. |
10. | https://doi.org/10.19044/esj.2019.v15n27p54 |
11. | Endut, A.; Jusoh, A.; Ali, N.; Wan Nik, W.B.; Hassan, A. A study on the optimal hydraulic loading rate and plant ratios in recirculation aquaponic system. Biores. Technol. 2010, 101(5), 1511–1517. https://doi.org/10.1016/j.biortech.2009.10.076 |
12. | Wongkiew, S.; Hu, Z.; Chandran, K.; Lee, J.W.; Khanal, S.K. Nitrogen transformations in aquaponic systems: A review. Aquacul. Eng. 2017, 76, 9–19. https://doi.org/10.1016/j.aquaeng.2017.01.001 |
13. | Taiz, L.; Zeiger, E.; Møller, I. M.; Murphy, A. Plant physiology and development (6th ed.). Sinauer Associates, 2015. |
14. | Lambers, H.; Chapin III, F.S.; Pons, T.L. Plant physiological ecology (2nd edn.). Springer science & business Media, pp. 545-544, 2008. |
15. | Marschner, P. Marschner’s mineral nutrition of higher plants (3rd edn.), Academic Press, pp.217-273, 2012. |
16. | Dore, I. Contribution to the study of integrated aquaculture–market gardening: Case of cucumber (Cucumis sativus) and catfish (Heteroclarias) [Master’s thesis, IUPA]. p.31, 2025. |
17. | Neththasinghe, N.A.S.; Wilson, A.B.; Lindsey, L.E.; Lindsey, A.J. Cold temperature and water effect on soybean (Glycine max [L.] Merr.) emergence. Plant Soil. 2025, 516, 1533–1551. https://doi.org/10.1007/s11104-025-07814-8 |
18. | Zhang, Y.; Kim, M.; Lee, B.; Kim, M.; Jeon, S.; Shin, P.; Jang, H.; Sun, J. Optimizing sowing time using cumulative temperature for improved soybean yield. Agronom. 2025, 15(12), 2767. https://doi.org/10.3390/agronomy15122767 |
19. | Kanangire, C. Physicochemical parameters of intensive Clarias gariepinus culture. Cahiers Agric. 2001, 10(3), 181–188. https://doi.org/10.1051/cagri:2001132 |
20. | Goudiaby, K. Study of Clarias gariepinus growth in aquaculture and valorization of aquaculture effluents in market gardening of three Japanese carrot varieties (Yellow carrot, Kintoki red, Okinawa orange ginseng carrot) [Master’s thesis, IUPA]. p.38, 2025. |
21. | Severin, M.; Okello, D.; Osano, P. Nitrate dynamics and crop performance in aquaponics. Agric. Sci. Res. J. 2014, 4(6), 109–115. |
22. | Goddek, S.; Delaide, B.; Mankasingh, U.; Ragnarsdottir, K.V.; Jijakli, M.H.; Thorarinsdottir, R. Challenges of sustainable and commercial aquaponics. Sustainability. 2019, 11(2), 419. https://doi.org/10.3390/su11020419 |
This work is licensed under the
Creative Commons Attribution
4.0
License (CC BY-NC 4.0).
Abstract
This study evaluated the effects of fish farming
effluents and a biofertilizer on the growth of soybean (Glycine max) in
an integrated system combining the aquaculture of African catfish (Clarias
gariepinus) with soybean cultivation. Fish culture water, rich in
nutrients from fish metabolism and excretion, constitutes a valuable resource
for crop irrigation, reducing the dependency on synthetic fertilizers. Three
irrigation treatments were compared: fish culture water, biofertilizer, and tap
water used as a control. The effects of these treatments on soybean growth
(number of leaves, collar diameter, stem length and yield), physicochemical
parameters of water and soil, as well as on fish growth performance were
analyzed. The results revealed significant differences among the treatments.
Irrigation with fish culture water induced the best vegetative growth and the
highest yield, due to its richness in major nutrients (nitrogen, phosphorus and
potassium). Tap water also promoted plant height growth, whereas the
biofertilizer produced the lowest performance in this regards. The
physicochemical parameters of the water, particularly pH, ranged from 6 to 9
and temperature varied between 28 and 30 °C, remaining within the optimal
ranges for fish development. Similarly, for plants, a temperature of 25 to 30
°C and pH of 6.2 to 6.8 were maintained under conditions favorable for growth.
Statistical analyses (ANOVA and PCA) confirmed significant differences among the
treatments. Clarias gariepinus exhibited rapid growth (>
2%/day) and a high survival rate (99.14%). The results demonstrated that the
reuse of fish culture water for soybean irrigation represents a viable
agroecological approach that contributes contributing to improved agricultural
productivity, reduced fertilization costs, and sustainable valorization of
aquaculture effluents.
Abstract Keywords
Fish culture water, biofertilizer, growth, soybean, catfish, survival.
This work is licensed under the
Creative Commons Attribution
4.0
License (CC BY-NC 4.0).
Editor-in-Chief

This work is licensed under the
Creative Commons Attribution 4.0
License.(CC BY-NC 4.0).